

Australia’s voice to parliament Polling catchments where Indigenous Australians form more than 50% of the population voted on average 63% in favour of the voice
Australia’s voice to parliament Polling catchments where Indigenous Australians form more than 50% of the population voted on average 63% in favour of the voice
Removed by mod
I think you’re misunderstanding the quote (or I’m misunderstanding you). That quote is supporting the same trend indicated in Wadeye. The 31.3% refers to QLD as a whole, not the ATSI dense communities specifically.
Removed by mod
I spent way too much time yesterday going through a full seat here in NSW comparing each polling location to the census data for that location, so I’m not going to do that all again for the entirety of QLD.
However, I did have a look at the QLD LGAs with the highest % ATSI populations and got the following results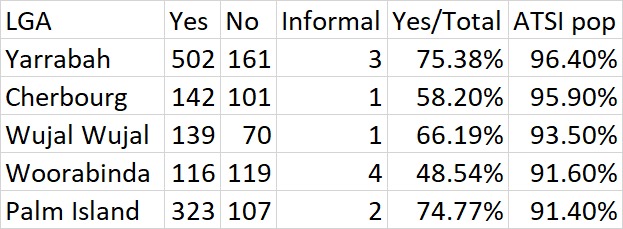
I think that’ll be the closest sort of data we can get to an idea of the QLD ITAS support for the voice
Removed by mod
Yeah, communities with ATSI population % that high tend to be pretty small after all, so polling places in those communities aren’t going to have a massive number of votes.
All the results for each polling centre can be found . The places I used as an example were across several different